maanantai 28. syyskuuta 2015

Using Bedouins as a reference, false or true history?

If we want to make true admixture analyses we need good ancestral references, but because we have not valid ancient genomes from Middle East we have used Bedouins to represent ancient unmixed Middle Easterners.  I have now tested them using qpDstat, Denisova and Neanderthal genomes as outgroups.  There is no way to predict how good those hominids can be, so let's look results.

 
In my opinion the result clearly shows African (Yoruba) similarity for Bedouins, meaning that if Bedouins are used as a reference some African admixture becomes hidden in results.  Also, it is hard to say how old this African similarity is.  It could be very recent or very old, but it is definitely present and distorts results in admixture analyses. 

There is certainly a statistical error due to the bad reference sampling, but in a big view the result is definitely directional. 

lauantai 26. syyskuuta 2015

Dstat reveals genetic distances


I have seen numerous PCA and ADMIXTURE analyses which try to demonstrate who are  full-blooded Europeans, as well as many analyses proving real or false migration inside/outside Europe.   This is sometimes misleading and hides actual European ancestry because admixtures revealed by selective tests can be very small and detectable only by detaching it from main history events in Europe.   My aim is now to find out large scale similarities inside Europe. This can be done by using dstat-analyses which compares whole genomes without dropping meaningful genetic proportions.  I do now tests by searching differences between suggested non-European and actual European ancestries.   

I suggest following non-European populations
  
  •  Nganassans representing pure Siberians, found in North Siberia and Northeast Europe

  •   Mongolians representing medieval Mongolian invasion to Europe

  •  Bedouins representing present-day Middle-Easterners, ruling out Early European Farmers

Doing any comparison needs a baseline, suggested least admixed Europeans.    Brits live in an island isolated from the mainland Europe.  People in Kent are thought to have their origin in Iron Age and medieval continental West Europe.  My previous analyses also prove that they have very little newer non-European admixtures, less than French and Germans. 

I use original Haak et al 2015 Lazaridis et al. 2014 data with additional British Kent and Finnish samples downloaded from the 1000genome project.  Each sample consists of 555268 SNPs. West Finns are filtered in three steps using PCA from 1000genome data:  1) removing 20 westernmost samples to get rid of possible Finland-Swedes, 2) splitting the rest 80 into eastern and western groups and finally 3) picking randomly 13 western samples.  Kents are randomly sampled as well.

 The data is available if someone wants to repeat my tests, or make own tests. Please contact me in that case. 

The first task to do is to verify the data.  For this purpose I ran three PCA-plots:


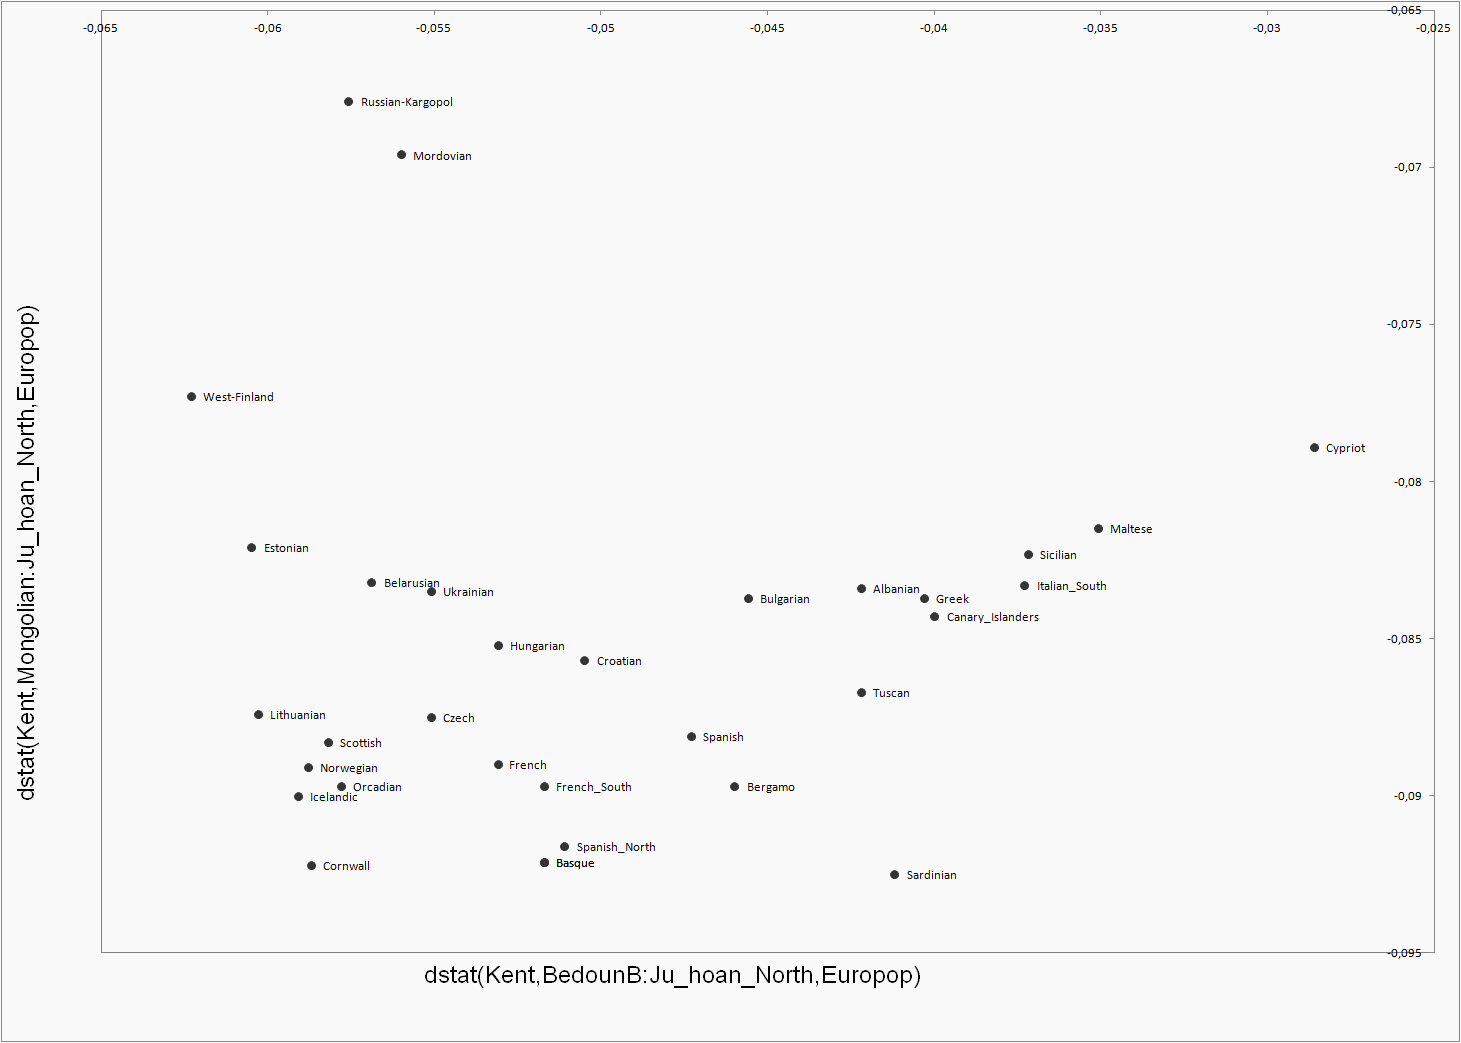
Before testing admixtures it is a good idea to see wide genome distances between British Kents and other Europeans.   I do it using two outgroups, the first one being extreme (Chimp), setting another one (Ju-hoan-North) to the base line.  


Admixture Dstat analyses follow the formula: 

dstat(Kent,non-European population:Outgroup,European population).  


If the result is negative the European population is closer to Kent than it is to the non-European population on axis, the bigger the negative value is the closer it is to the Kent compared to non-European population.  Be aware of the fact that this test doesn’t figure how much the population under test has non-European admixture in question, but the full genome genetic distance between populations, which mainly depends on the common history between population pairs.  If tested European population is “multimixtured” then the result could be surprising for a reader who has seen only analyses figuring minor admixtures.   In other words, your genetic profile can be A1+b or A2+c, where b and c are minor admixtures. You can’t figure the overlapping  between A1 and A2 without knowing both minor admixtures if you try to do it using PCA or ADMIXTURE, but you can use dstat to determine genomewide similarity.


lauantai 19. syyskuuta 2015

New study claims that Finns have not Mongolian admixture

A month ago I commented here about a mistake in admixture results regarding Asian admixture in Finland.  It didn't take long to see a new study telling a different Finnish story.  In this new study authors claim that the Asian admixture in Finland is North Asian (Siberian), not Mongolian, which seems to be right.  However they have also two drawbacks included making the result as to the Finnish admixtures less accurate.   First the study gives a wrong idea about Finnish and Saami histories. Secondly the study uses only two Finnish samples which makes almost impossible to see accurate admixture amounts in Finland and it makes also impossible to specify any Finnish admixture in other populations, like in Scandinavians.   I can't understand why authors decided to use only two Finnish samples because we have publicly ready to download 100 Finnish samples from the 1000genomes project and 1000genome samples are much better than used samples, including around 10 millions SNPs per sample. 

keskiviikko 2. syyskuuta 2015

Big intrapopulational difference between homozygous and heterozygous groups in Dstat analyses


Keeping in mind that almost all ancient samples show high homozygosity due to real isolation or due to scanning imperfections I thought it would be reasonable to see if this has an impact which can be detected in comparison with modern samples.  My tests show that homozygosity has a clear-cut impact on Dstat results, but the same effect probably can also be seen in such an iterative method like admixture analysis and in selective methods like PCA.  The impact is clear but what it tells is not so clear. Anyway I can tell that intrapopulational results of genetic tests can be modified easily, even if tested populations are generally homogeneous.   An interesting question is whether these differences between intrapopulational homozygous and heterozygous groups indicate 1)  differences in admixtures or 2) increasing homozygosity gained by isolation.    In the first case we really should use this kind of grouping to see admixtures and to find least mixed samples.  In the second case the result is an artifact and it can’t tell us about similarity between ancient and modern samples.

Testing arrangement

In the first step I split preselected populations into two groups, each populaion into the least homozygous one and the most homozygous one. Secondly I made intrapopulational Dstat tests to see which of preselected populations showed biggest difference between aforementioned groups inside each population.  This revealed that Poles and Lithuanians showed biggest differences.  In the third step I made Dstats using Polish samples, comparing most homozygous Poles to least homozygous groups of other populations and again least homozygous Poles to most homozygous groups.   Results show maximum differences in Dstat results between preselected populations and Polish groups.  The result also shows that more homozygosity in Polish results gives better fit with ancient samples.  

Intrapopulational differences:


 Least homozygous Polish samples:


 Most homozygous Polish samples:

Edit 03.09.2015 11:40

Here is the list of homozygosity, sorted in descending order (most homozygous on the top).  Minor chnages are possible with my earlier similar lists because I added now all samples, not only those who are included on PCA.plots.

I promised to add also more comparison graphics, similar to the earlier ones, but at first I have to change the baseline from Polish samples to Lithuanian ones.  Unortunately Polish samples have turned out to be Estonians with Polish ancestry.  Although this changes nothing regarding the homozygosity effect in Dstat, it is fair to fix this dilemma.

Sardinian    67,60384207
Basque    67,44280127
Ireland    67,33544553
Veps    67,17523119
Latvia    67,14166269
Lithuania    67,1174451
East-Finland    67,11566053
Estonia    67,11277197
Scottish    67,0812723
RU_Smolensk    67,07361591

RU_Pinega 67,0612015
Karelia    67,05115015
Orcadian    67,01296233

Estonian Polish   67,00173422
Udmurtia    66,99770479
West-Finland    66,98712708
RU_Tver    66,92457987
NorthItaly    66,91797098
Norway    66,89626223
Belarussia    66,89249304
RU-Kostr    66,89235494
Sweden    66,86137284
Mari    66,84108804
Welsh    66,83034825
Croatia    66,82331402
Slovenia    66,80990947
Kent    66,80441748
Ukraine    66,79078295
Greece    66,77843135
France    66,77604594
Serbia    66,77377835
RU_west    66,76312088
SouthItaly    66,75665724
Hungary    66,73613581
Mordva    66,73504358
Slovakia    66,73287848
Germany    66,72801283
Utah_CEU    66,72730319
Romania    66,71731193
Tuscany    66,7091015
Cypriot    66,70819397
GermanyAustria    66,67125944
RU_Vologda    66,66611906
Sicily    66,66495331
Spain    66,65744707
Italy    66,65350021
Komi    66,64641008
Bulgaria    66,63059519
EastSicilian    66,61540638
Chuvash    66,59975022
Tatar    66,19179731

keskiviikko 19. elokuuta 2015

The Baltic question


After getting Latvian samples it is good time to try to make an effort to define Baltic genetic position among neighbors.  As far as I had only Lithuanians I was not sure are they representative for all Balts.  In numerous tests Lithuanians are seen as least mixed North Europeans.  This can be true, but even then they have to resemble their neighbors in south, east and north.   I try to find this out using PCA, but there are some general problems regarding it.  The position of each sample on PCA mainly depends on two factors:  1) common components with other samples and 2) components differing from other samples.  There is no problem with the first factor, because it reveales something we are just searching for, but the second factor is problematic.  In practice the second one consists of genetic drift between local samples or distinct admixtures.  Genetic drift is something that makes some populations differing from all other populations, because it is a fully local attribute.   So, to make an objective view showing genetic relations between populations we should decrease genetic drift.  There is a simple way to do it – reducing the population sample size on PCA.  Those who have more math skills can give pedantic explanations why this is true, I can only say that in practice you can reduce the effect of local genetic drift by reducing sample size, and increase it by inflating sample size. 

In my previous test (here) you see the following figure:


We see that Balts are very close Slavs, but also in the minimum of y value.  This means that the Balts show something more than any other population on the plot (with exception of two Belasrussian). By redusing the Baltic sample size we can see what happens if we get rid of this local and excessive Baltic attribute, which doesn’t imply directly any large scale commonness among other Europeans.  On the other hand eastern Finnic groups are placed on the plot to the maximum of Y value.  Can we assume that populations living almost in neighborhood, like Balts and Karelians could form genetic extremities within whole Europe?  I don’t believe it, it is question about local genetic drift which makes things look weird.  To reduce the drift I reduced the Baltic sample size from 16 to 8 and here is the result:


Unfortunately SmartPCA flipped the x-axis.

You can see a new loose cluster including Balts and Finnic groups, excluding Finns who are closer Scandinavians.  The Balts are still close Slavs, but now between them and Finnic groups in a manner pretty much corresponding with the geography.    

edit 24.8.2015 18:40

I have here a bit more information regarding the divergence of tested populations.  If any of sample groups show smaller divergence than average and are undoubtedly overrepresented the result will be biased on PCA.   Following numbers are gathered from the SmartPCA output and sorted by divergence.  (These numbers represent only the available academic data, not real populations. I am quite sure that for example the divergence in Sweden is higher.)


perjantai 14. elokuuta 2015

What's wrong with populaton genetics, part 2.


I have not evaluated new studies regarding weird results since this.  However, now I have to break the silence because people never stop writing new history without first reading already the known one. Yesterday I got in my hands this one:


They obviously claim that Northern Russians and Finns have Mongolian admixture.  The known European history doesn’t support this idea.  They also got a result showing that the East Asian admixture in Nortern Russia is around 1300 years old and in Finland around 1800-1900 years old.  This sounds reasonable.  I am not sure about the North Russian history, but in Finland migrating Finns met earlier migrated Saamis around 1500-2000 years ago.   Today Saamis show up to 20-30 % North Eurasian admixture depending on the used method, of similar kind what is found among North Siberian people.  Mongolians doesn’t live and didn’t live in Northern Scandinavia or Northern Siberia.  They never migrated to Northern Norway where most Saamis live today (it is likely that elevated North Asian in Orkney Islands is also due to the polar migrations through Norway).  Also the PCA they have included to the study suffers from under- and oversampling, but it is another story. 

I see that authors of this study simplify things everywhere it is necessary to support the inevitable outcome they have.   I am not going to walk through the whole text, only noticed obvious things regarding the Finnish history.  It is pity that even methodically right and fine results are destroyed by messing with primary school level knowledge of history.  So conclusions they made are wrong even when analyses are right.   I wouldn’t care much, but it is really sad that the known history is faked by peer reviewed studies.   So what is the value of research if peer reviewing doesn’t work properly and our history gets new interpretations again and again.     


Some ancestral changes in Iron Age Estonia

QpAdm was designed to detect admixtures giving also probability and standard error statistics.  Two kind of parameters are inputted: admixtu...