tiistai 26. joulukuuta 2017

Eastward migration of Finns

The origin of Finns is very indisputably from the Migration Period.  Times before it are still unclear as well as the history of  Northeastern Europe in its entirety, including at least Baltic areas and North Russia.  We can talk about Comb Ceramic, Corded Ware, Kiukainen cultures et cetera, but no one can make a true link between Stone Age cultures and the origin of modern Finns and their language and connect them to Finland.  Furthermore, the main stream linguist theory tells that our language came from the Volga basin, but it can't be proven by genetics.  Nothing in our genes links us to the Volga basin, although a large crowd enthusiasts can see it and try to prove it.  Unfortunately for them,  no respected scientific evidence has found to support this idea,  all genetic evidences has been opposite so far.    

Because we know very little about the time before the Migration Period in Finland, let's start from it.  Here are some professional views, made by non-Finnish scientists.  At first a two-piece video document of Swedish production about Baltic Sea Vikings, touching also Finns.

https://www.svtplay.se/video/16169343/ostersjofinnarna/ostersjofinnarna-sasong-1-avsnitt-1

https://www.svtplay.se/video/16169303/ostersjofinnarna/ostersjofinnarna-sasong-1-avsnitt-2?start=auto

What is interesting is how they see the beginning of Finnish settlements.  Six screenshots show how ancient Finnish settlements spread across Southern Finland and continued to the Lake Ladoga.  The presentation doesn't show the whole picture.  Our genes and language imply that they went much further to the east, at least to the Lake Onega in Northern Russia.  There is also an open question about Southern Finland.  Until now scientists have supposed that Southern Finland around our present-day capital town was uninhabited to the Swedish era.  New archaeological finds can change the history and also explain a new straight route from Southwest Finland to Karelia.  Anyway there must have been a southern route to Viking Age Ladogan settlements and Staraja Ladoga/Aldeigjuborg.


The scientific view is clear, the migration flow during the first millennium was from west to east, not from east to west.

Here is another view, a German one from Wikipedia, showing Viking settlements.  No matter how we interpret Vikings, we sure can't consider that all Scandinavians were Vikings, neither all Finns or none of them, but here we have a view about Viking Age settlements linked together.   Note that Ostrobothnia is considered as a Viking settlement.  In some sources it is assumed to have had a Swedish-Saami settlement, disappearing during the Viking Age.


German studies written by Steuer give more information about archeology and evidences about settlements during the Migration period and the Vendel era.

Ring swords


Counterweight of silver scale in the late Viking Age.  It is amazing how many counterweights in purpose to weight silver coins have been found in Finland, especially in comparison to its small population.  The Finnish population was much smaller than the Swedish one and even smaller than in Estonia.  In Estonia it was around three or four times bigger than in Finland.  Only after Northern Crusades the arrangement changed and little by little the number of Finns grew while Estonians suffered from its colony status.

Counterweight


A German book "Die Wikinger", written by Brenda Ralph Lewis, Hildegard Elsner and Nikolai Smirnov locates the heartland of Vikings.


All above was presented as an introduction to my genetic work.  Although the view shown above is anything but perfect and especially some Viking Age settlements can be criticized, it is clear that scientists can't fabricate the history and lie about the migration direction.  It is reasonable to note that my work follows the scientific view.

My new tests are based on 800000 SNP's, 744 samples and globally 104 populations. The data was haplotyped using newest available reference data from the 1000 genomes project and Shapeit software.  Haplotype data was processed using Chromopainter V2 in two steps, the first step to define run parameters, and the result is reported using Globetrotter.  Results show the best present day fit of selected population using all 103 populations as donors.

Finnish samples, 99 individuals from the 1000 genomes project are grouped into four groups using self-reporting of my project members. We see that the Finns can be defined internally with exception of the group 1, which can define other Finnish groups.   Nothing points to migrations from east, even though the data is global. 


Finnish group 1

Finnish2             0,408
Scandinavian      0,262
Finnish3             0,245
Slavic                 0,036
Near-East           0,018
Mari_Chuvash    0,012


Finnish group 2

Finnish4             0,567
Finnish1             0,378
Finnish3             0,054


Finnish group 3

Finnish4             0,783
Finnish2             0,217


Finnish group 4

Finnish3             0,738
Finnish2             0,262


Karelian-Vepsa (Eastern Baltic-Finns)

Finnish4             0,373
Baltic                   0,307
Finnish2             0,212
Mari_Chuvash     0,062
Saami                  0,017


Mordvas


Slavic                  0,516
Tatar                   0,195
Karelian_Vepsa 0,122
Baltic                  0,058
Mari_Chuvash    0,043
Caucasian          0,011


Mari-Chuvash

Tatar                   0,406
Mordva               0,256
Bashkir                0,170
Khanti-Mansi       0,090
North_Siberian   0,018
Karelian_Vepsa 0,013
Tungusic             0,011

  
Scandinavians (academic Swedish samples)

West_Europe    0,573
Finnish2           0,164
Baltic                0,162
Finnish1           0,058
Finnish3           0,031

Finnish 1 includes 26,2%, Finnish2 9,9% and Finnish3 2,1% Swedish ancestry.  


Control results

British Isles 1 (Kent)

British_Isles3    0,487 (Scottish)
West_Europe     0,453
British_Isles2    0,057 (Cornwall)


Bosnia-Hertsegovina Romas

Armenian        0,375
South_Asian    0,224
Balkan             0,195
Slavic              0,122
Near-East       0,021
Caucasian       0,017
Central_Asian 0,017


tiistai 28. marraskuuta 2017

Historical admixture results

I am running historical admixtures using Globetrotter software.  The results will be added to this same blog entry.

Western Volga-Finnic (mainly Mordvas)

time:  36 generations, near 1000 years ago

East_Slavic    0,4867536482
Baltic    0,2887079451
Central_European    0,0570663623
Mongola    0,051551692
East_Volga_Finnic_Chuvash    0,04939485
Mansi_Khanty    0,0270296952
East_Baltic_Finnic    0,0169141037
South_European    0,0098787291
Central_Siberian    0,0073332031
North_Siberian    0,0023436624
North_Baltic-Finnic_G4    0,0015424098
Saami    0,0014836991

East_Volga_Finnic_Chuvash stands for Maris, Chuvashes and Udmurts, East Baltic Finns for Karelians and Vepsians, North Finnic G4 for Ingrians.

Scandinavians

West_European    0,6080567694
Baltic    0,203714483
North_Baltic_Finnic_G3    0,092400554
North_Baltic_Finnic_G1    0,0431817267
East_Slavic    0,0387924755
Saami    0,0096464481
North_Siberian    0,0042075434

Globetrotter was not able to infer the admixture date.  Groups North_Baltic_Finnic_G1 and North_Baltic_Finnic_G3 are both Finnish. I modified references from the previous blog entry.  Now the South_Baltic_Finnic is split into Baltic and Finnish portions.

Saami

time: 56 generations, around 1500 years ago

East_Baltic_Finnic    0,2279573629
North_Baltic_Finnic_G1    0,1883732327
North_Baltic_Finnic_G3    0,134836117
Basque    0,1242665217
North_Siberian    0,1043483876
West_European    0,0686019039
Central_Siberian    0,0590794466
North_Baltic-Finnic_G4    0,0513959273
Baltic    0,0303972753
East_Volga_Finnic_Chuvash    0,0107438251

Groups North_Baltic_Finnic_G1 and North_Baltic_Finnic_G3 are Finnish, North_Baltic_Finnic_G4 is Ingrian and East_Baltic_Finnic is Karelian+Vepsian.  Basque ancestry was higher that among modern Saamis.


-------------------------------------------------------------
 update 30.11.17

After separating Estonians from the main Baltic group it is possible to test also Estonians.  At first however Finnish results,  Estonians still with Balts.


North Baltic-Finnic, group 1

time: 70,6 generations, near 2000 years ago

Baltic    0,7403595543
Saami    0,1586845132
Mansi_Khanty    0,0874546485
North_Siberian    0,0117447072
Central_Siberian    0,0017565769

Basically this was expected,  the Baltic part (including Estonians) is highest and the rest is composed from Euro-Siberian populations.  What surprises is the Mansi-Khanty part, I would have expected  even more Saami or some Mari-Chuvash -like minor admixture.   However the magnitude is right; three quarters Baltic plus one quarter mixed Euro-Siberians.   2000 years sounds credible, it is near the time of the migration of Baltic Finns to Finland.


North Baltic-Finnic, group 2

time: 43,8 generations,  around 1200 years ago

Baltic    0,6802833838
Scandinavian    0,1470929006
Saami    0,1149188786
Mansi_Khanty    0,0503062607
Central_Siberian    0,0038576149
North_Siberian    0,0035409614

Scandinavian admixture appears around 1200 years ago.  It is impossible to name any exact Scandinavian migration or demographic event in Finland, but the first Swedish crusade can be ruled out.  Scandinavian increases, Baltic and Euro-Siberian decreases.


North Baltic-Finnic, group 3

time: 69 generations, around 1900 years ago

Baltic    0,7973987698
Saami    0,1346869263
Mansi_Khanty    0,0644377493
North_Siberian    0,0032512571
Central_Siberian    0,0002252975

The group 3 is very similar to the group 1, both are Finnish, as well as the group 2.


North Baltic-Finnic, group 4 (Ingrians)

time: 106 generations, around 2900 years ago

Baltic    0,7901064987
Saami    0,1221914423
North_Siberian    0,0845129477
Central_Siberian    0,0031891113

Surprisingly this doesn't look like an East-Finnish migration, which was expected.  It reminds me of an extinct Baltic-Finnic population.


Eastern Baltic-Finnic (Karelians and Vepsians)

time: 43,2 generations, near 1200 years ago

Baltic    0,8118374791
Saami    0,099396225
East_Volga_Finnic_Chuvash    0,0295501283
Mansi_Khanty    0,0263499058
Central_Siberian    0,0214967778
North_Siberian    0,0113694841

Near 1200 years match with the formation of East Baltic-Finnic people.


Estonians with Finnish references

time unclear

Baltic    0,3959754479
East_Slavic    0,3691411424
North_Baltic_Finnic_G1    0,1308129559
West_European    0,0752899347
Basque    0,014077665
Saami    0,0090402024
Mansi_Khanty    0,0037994745
Central_Siberian    0,0018631772

perjantai 17. marraskuuta 2017

Introductory Globetrotter analysis

Globetrotter is a new software being able to estimate admixtures and also admixture dates. The analysis itself is based on autosomal haplotype data, which is produced by the software Chromopainter, version 2.  My job queue was Plink, Shapeit, CromopainterV2 and Globetrotter.   The Plink format data consisted of 399000 SNPs and 254 individuals over the Eurasian continent.  I liked to have more individuals, but I can use only publicly available data and it is always my restriction.

In the first phase I made a phylogenetic tree using softwares Chromopainter and Finestructure.  Chromopainter was run in two phases, at first to define necessary run parameters and in the second phase generating a tree figure and ancestral matrices.  In the next step individual samples were grouped according to the phylogenetic tree and the result was moved to the following Chromopainter runs preceding Globetrotter analysis.  So there was no handmade grouping and all definitions were done by softwares.

Results:


Admixtures

The deep past can't be figured correctly by present day populations.  Names like Finnish, Polish and Eastern_Baltic_Finnic didn't exist thousands years ago and all group names should be understood representing something now unknown.  Another imperfection is that some populations are unmixed.   For example Balts and Basques cannot be defined by any other present day populations, with exception of themselves, which is not clever at all if we want to see ancient migrations.   In those cases there are sure unknown ancient admixtures without present day proxies and for example Balts are figured as East Slavs.

Finns

Khanty_Mansi    0.00669230541442569
Saami    0.0318001424720861
Scandinavian    0.0406288973530398
Eastern_Baltic_Finnic    0.372195068297064
South_Baltic_Finnic    0.547727866737746


Saami

Basque    0.00627519770432461
West_Europe    0.0203347268787166
Mongola    0.0285387511835476
Nganasan    0.0312587449978488
Irish_Scottish    0.0348178173049934
West_Siberia    0.0372717151545831
Khanty_Mansi    0.058915141944102
Eastern_Volga_Finnic_Chuvash    0.108026814008228
Eastern_Baltic_Finnic    0.120473106582914
Finnish    0.554087984240742


Irish

Basque    0.0168485068643567
Southwest_European    0.085582697894791
West_Europe    0.897568795240852


Tatar

Saami    0.00341643675195708
Nganasan    0.00501267346037914
RushanVanch_Tajikistan    0.00854395216066372
West_Siberia    0.0142527316035022
Irish_Scottish    0.0232322099579794
South_Baltic_Finnic    0.0375544108580537
Baltic    0.0616973387576695
Mongola    0.102871971437878
East_Slavic    0.119214847082816
South_European    0.12153228301688
Eastern_Volga_Finnic_Chuvash    0.184584853664197
Western_Volga_Finnic    0.317983363220266


Khanty-Mansi


RushanVanch_Tajikistan    0.00496570412383918
Western_Volga_Finnic    0.00973524498071095
Saami    0.0209045306129885
Scandinavian    0.0314001203298436
Mongola    0.0468217500718522
West_Europe    0.0512201282635752
Eastern_Volga_Finnic_Chuvash    0.322872736453914
West_Siberia    0.510808280436572


Scandinavian

Baltic    0.0039132358786016
Saami    0.0040658994834093
South_Baltic_Finnic    0.331326055831535
West_Europe    0.660694808806454


Western Volga-Finnic

West_Siberia    0.001211877430627
Basque    0.00153548108955792
Mongola    0.00217721497484364
Irish_Scottish    0.00441065912271718
Nganasan    0.00489486172279255
Saami    0.00654435392074552
South_Baltic_Finnic    0.00873613821602628
Khanty_Mansi    0.011149101703621
Eastern_Volga_Finnic_Chuvash    0.0443170163661487
Tatar    0.170123511582196
East_Slavic    0.744899783870725


Baltic

Saami    0.00434883756492699
East_Slavic    0.995651162435073


East Slavs

Western_Volga_Finnic    0.0180131830693537
Mediterranean-East    0.0941857330298036
Central_Europe    0.170383068761459
Baltic    0.717418015139384


Basque

Southwest_European 1


South Baltic-Finnic
  
Saami    0.0015403209540466
Basque    0.00277573750507665
Irish_Scottish    0.00668755305870894
Southwest_European    0.0131644799855559
Eastern_Volga_Finnic_Chuvash    0.0132143162745874
Eastern_Baltic_Finnic    0.0231748074310308
East_Slavic    0.152341012943326
Baltic    0.168097194491377
Scandinavian    0.203236330851964
Finnish    0.415614563156978


East Baltic-Finnic

Nganasan    0.00749839275609302
Khanty_Mansi    0.0101318772456883
Saami    0.0189334364744419
Eastern_Volga_Finnic_Chuvash    0.0341857812007321
Western_Volga_Finnic    0.0445466151938662
Baltic    0.259991450633669
Finnish    0.624712446495509


Finnish admixture dates and proportions.  

date in generations:  69.2367424689291

admixtures:


Khanty_Mansi 0,0290405745
Nganasan 0,0343370651
Saami 0,0360340021
Russian_Pinega 0,0402546721
South_Baltic_Finnic 0,8603336861

The software inferring admixture dates is quite sophisticated and I am still learning how to use it.   Before knowing more about it  I can't comment previous results, they are "as is".   


sunnuntai 29. lokakuuta 2017

Tollense Valley Bronze Age battle field, standardized PCA-results

Using the same standardized data we have the following PCA plot, which differs from what we see on plots made using only partly overlapping SNP sets.  I don't see any reason to use Mediterranean samples, because of the small SNP number of some samples.  What we see in general on the plot is that most ancient samples  fall between Germans and Poles.  We see also that Finns, Russians, Poles and Norwegians show genetic drift.  The most Polish ancient sample is WEZ56 and WEZ54 falls inside the British cluster.  Samples WEZ39, WEZ40 and WEZ51 fall somewhat closer Finns, being still Central European. WEZ56 is the most Polish sample in the original study graphics too.


lauantai 28. lokakuuta 2017

Tollense Valley Bronze Age battle field, standardized F3-results

According to my experience the f3-analysis (and dstat) generates error due to differences in SNP numbers between individuals.  Because the SNP number can vary as to the sample source, I removed all "bad" SNPs from the study data and added Finnish samples to make it equal to other sample groups.   Actually the average SNP amount in individual tests didn't change much from the original situation, with exception of samples gathered from the 1000genomes project.  After this operation the SNP number in each test between ancient and modern samples was almost constant.

Average SNP numbers per ancient sample, the difference inside one test group a few hundreds in maximum

WEZ15    56606
WEZ16    5453
WEZ24    13749
WEZ35-2    28766
WEZ39    9343
WEZ40    21711
WEZ48    6392
WEZ51    15313
WEZ53    14758
WEZ54    29468
WEZ56    28034
WEZ57    34161
WEZ58    21152
WEZ59    28256
WEZ61    34657
WEZ63    11920
WEZ64-1    26150
WEZ71    15698
WEZ74    9891
WEZ77    15721
WEZ83    14999

 Result of f3-tests using Mbuti as an outgroup:


All data with exception of Finnish samples (1000genomes) are from the study

Addressing Challenges of Ancient DNASequence Data Obtained with NextGeneration Methods


torstai 21. syyskuuta 2017

Estimates of ancient mixture proportions in present-day Europeans / software

The first Linux script makes possible to generate 23andMe format files from EIGENSTRAT-data and the second one estimates ancient mixture proportions of European people.  Download the full package (without Python interpreter) here.   Instructions are included in the README file.

lauantai 16. syyskuuta 2017

European ancient admixtures

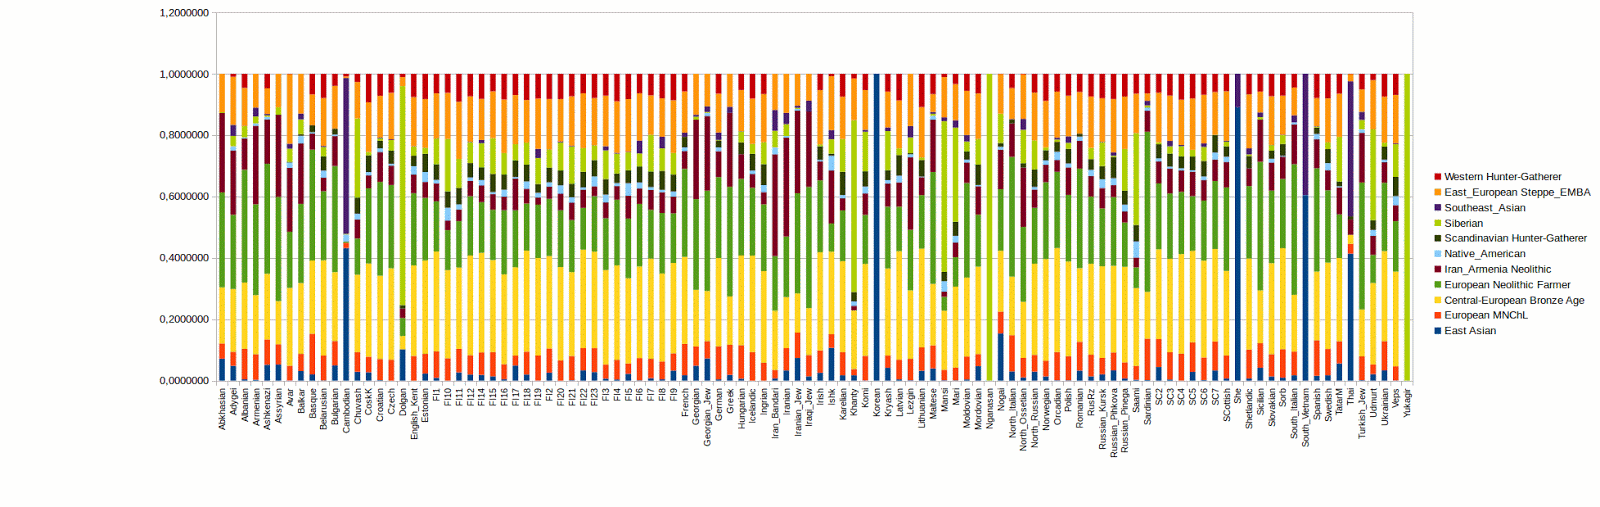
This admixture test was done using the latest data from Reich Laboratory and Dna.Land's Admixture program.  Instead of following the rule and using a mixture triangle Steppe-Farmer-HG I picked also the Central-European Bronze Age to ensure the best coverage of European ancestry.  European Bronze Age was built up from all those three dimensions, so results of all those three roots will be somewhat lower than in tests without the European Bronze Age.  This test works best for Europeans and have obvious blind spots in Africa, Northern America, Near East and Central Asia. I took also some Western Asian samples in the interest of seeing the Iranian and Armenian Neolithic proportions.  

All samples were picked randomly, one sample per population, not as population averages.  No consensus was run.   Both, averaging and consensus calculation would minimize fluctuation in results of minor components, like between Siberian and East-Asian.  The data was converted from the EIGENSTRAT data format I usually use in my tests, of course with exception of the project members.  For that purpose I made a small Bash script which converts Eigenstrat to 23andMe format.  The data and Dna.Land's Admixture program will be soon available here and if anyone see the Eigenstrat-to-23andMe conversion useful I'll include also it to the downloadable library.

Some ancestral changes in Iron Age Estonia

QpAdm was designed to detect admixtures giving also probability and standard error statistics.  Two kind of parameters are inputted: admixtu...