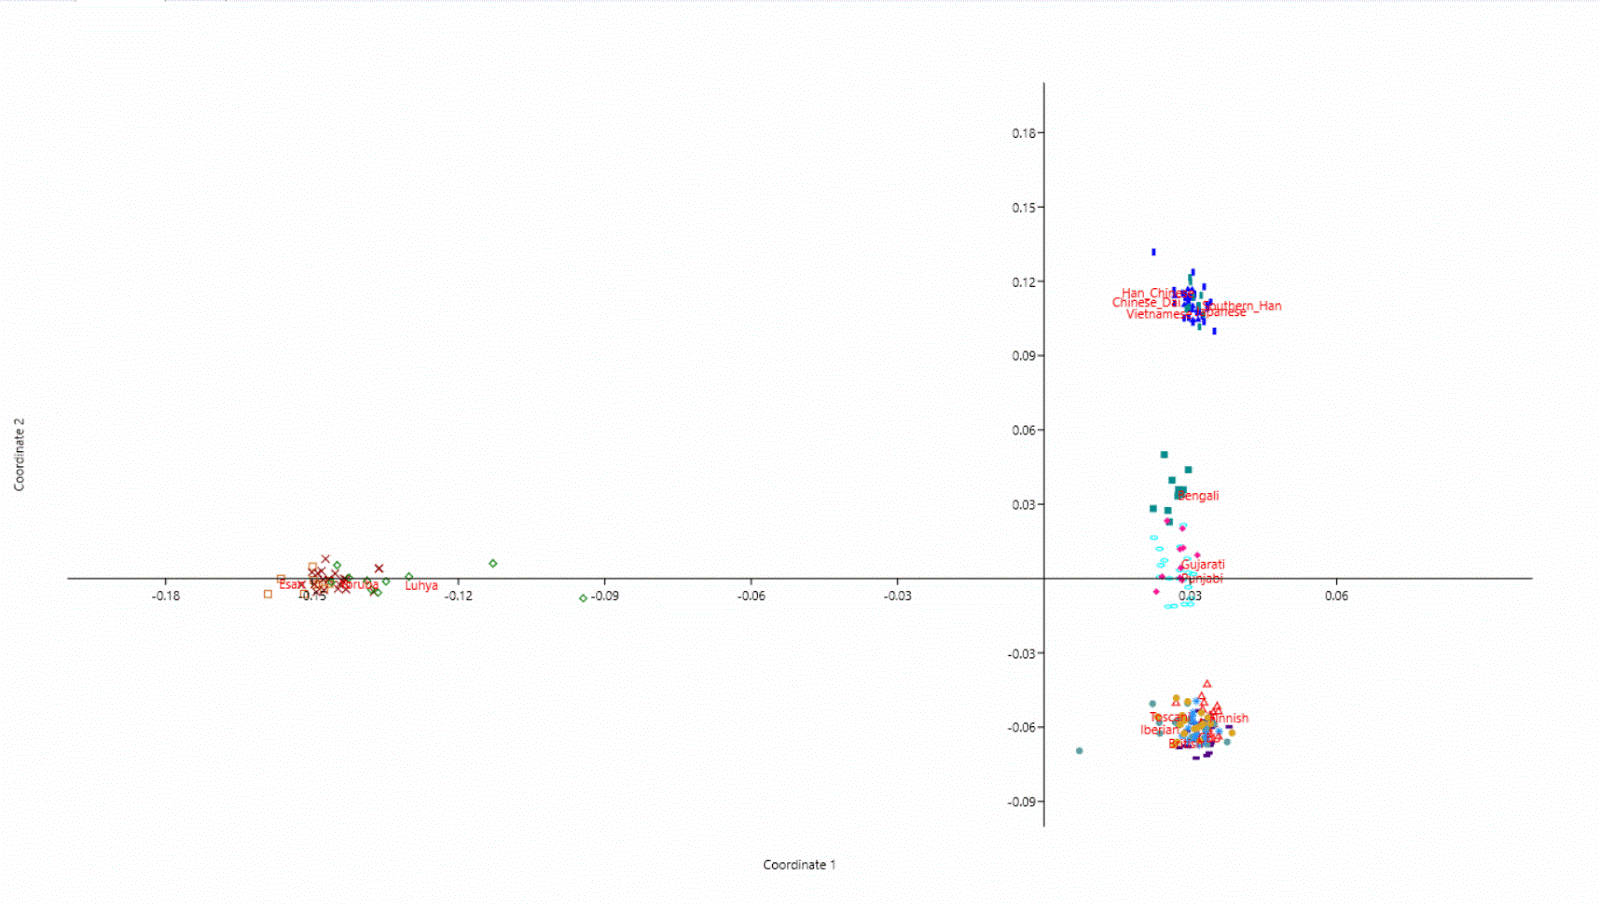
My previous test was missing of German reference samples. Together with the fact that my Swedish reference samples seem to be somewhat off, this gave results biased towards Balto-Slavs. I have now added German samples available from Pagani et al. 2016 and have rerun all project samples, plus two new Finnish samples. Additionally I tested three Finnish samples introduced by aforementioned study. Soon after downloading those samples I understood that they don't represent average Finns. So this point is included after project results.
I had difficulties in editing columns and after some useless efforts I copy-pasted all in plain text format.
A new grouping, Karelian-Finnic indicates a sum of Karelian and Veps people.
FI1
Finland 57,0
AMBIG_Europe 25,0
Balto-Slavic 12,9
AMBIGUOUS 2,6
Baltic-Finnic 2,5
FI2
Finland 37,2
AMBIG_Europe 28,0
Balto-Slavic 14,8
NW-Atlantic-Europe 10,6
AMBIGUOUS 5,6
Saami 3,9
F3
Finland 62,3
AMBIG_Europe 33,0
AMBIGUOUS 2,4
Baltic-Finnic 2,3
F4
Finland 47,2
AMBIG_Europe 18,9
NW-Atlantic-Europe 18,1
Northeast-Europe 15,8
FI5
Finland 53,8
AMBIG_Europe 33,1
Baltic-Finnic 11,7
AMBIGUOUS 1,4
FI6
Finland 43,0
AMBIG_Europe 36,0
Baltic-Finnic 12,5
NW-Atlantic-Europe 7,9
FI7
Finland 78,7
AMBIG_Europe 17,4
TunNenets 3,4
FI8
Finland 56,5
Karelia 25,4
AMBIG_Europe 17,4
FI9
Finland 42,1
AMBIG_Europe 27,7
Karelia 24,5
Karelian-Finnic 5,0
FI10
Finland 43,1
Saami 21,5
AMBIG_Europe 10,9
Karelian-Finnic 10,2
AMBIGUOUS 10.0
AMBIG_Siberian 4,3
FI11
Finland 63,7
AMBIG_Europe 31,7
AMBIGUOUS 2,8
Baltic-Finnic 1,8
FI12
Finland 71,6
AMBIG_Europe 18,0
Central-Europe 10,2
FI14
Finland 69,8
Balto-Slavic 16,0
AMBIG_Europe 11,3
Baltic-Finnic 1,6
AMBIGUOUS 1,3
FI15
Finland 62,0
Karelian-Finnic 21,2
AMBIG_Europe 14,9
AMBIGUOUS 1,9
FI16
Finland 43,1
AMBIG_Europe 22,9
Estonia 21,8
Karelia 10,3
AMBIGUOUS 1,8
FI17
Finland 33,9
Central-Europe 24,0
Karelia 13,8
Baltic-Finnic 9,8
AMBIG_Europe 9,5
RU_Pinega 5,6
AMBIGUOUS 2,1
Karelian-Finnic 1,3
FI18
Finland 46,1
Karelian-Finnic 19,7
Balto-Slavic 14,5
AMBIG_Europe 8,8
Baltic-Finnic 6,5
Saami 3,7
FI19
Finland 0,62
AMBIG_Europe 0,20
Northeast-Europe 0,08
RU_Pinega 0,05
Saami 0,03
AMBIGUOUS 0,02
FI20
Finland 57,8
AMBIG_Europe 21,8
Balto-Slavic 10,9
AMBIGUOUS 5,1
Baltic-Finnic 4,3
FI21
Finland 53,1
Karelia 28,0
AMBIG_Europe 10,7
Northeast-Europe 4,8
AMBIGUOUS 2,2
Karelian-Finnic 1,2
SC2
NW-Atlantic-Europe 32,8
Central-Europe 32,5
Balto-Slavic 19,3
AMBIG_Europe 13,3
AMBIGUOUS 2,1
SC3
Baltic-Finnic 27,6
Central-Europe 21,2
AMBIG_Europe 19,3
Norway 17,5
NW-Atlantic-Europe 12,9
AMBIGUOUS 1,6
SC4
Norway 53,0
Central-Europe 18,3
Balto-Slavic 13,7
NW-Atlantic-Europe 8,1
AMBIG_Europe 6,5
SC5
AMBIG_Europe 28,9
NW-Atlantic-Europe 18,3
Central-Europe 18,3
Ireland 14,1
GermanyAustria 11,5
Northeast-Europe 7,9
AMBIGUOUS 1,0
SC6
Central-Europe 31,5
NW-Atlantic-Europe 24,7
AMBIG_Europe 16,5
Finland 14,5
Balto-Slavic 11,9
AMBIGUOUS 1,0
SC7
AMBIG_Europe 29,7
NW-Atlantic-Europe 26,1
Sweden 20,5
Orcadian 11,0
Central-Europe 10,7
AMBIGUOUS 1,9
Additionally some freely available genomes, only for checking the method.
Genomes Unzipped, VXP
North-Italy 24,9
Central-Europe 20,7
AMBIG_Europe 18,4
Norway 13,7
NW-Atlantic-Europe 12,0
South-Europe 6,6
AMBIGUOUS 3,8
Genomes Unzipped, JKP
Central-Europe 28,9
South-Europe 19,8
NW-Atlantic-Europe 19,1
Spain 12,5
AMBIG_Europe 11,3
AMBIG_WEURASIA 5,8
AMBIG_SEURASIA 2,0
Razib Khan, downloaded here.
Indian 35,6
Sindhi 22,3
Cambodian 12,8
AMBIGUOUS 10,6
Burusho 8,6
IndianJew 6,3
AMBIG_Southeast-Asian 2,4
AMBIG_EEURASIA 1,4
Blaine Bettinger, downloaded here.
He looks British, with a small portion of Native American.
Central-Europe 24,9
Kent 24,1
AMBIG_Europe 21,2
Welsh 9,3
AMBIGUOUS 7,9
Ireland 7,3
Atlantic-Europe 3,3
Native-American 1,9
Tests using Pagani et al. Finns as a Finnish reference
Pagani-FI12
Karelia 28,0
AMBIG_Europe 23,8
Central-Europe 17,8
Baltic-Finnic 12,6
Finland 12,1
Karelian-Finnic 3,4
AMBIGUOUS 2,4
Pagani-FI14
Estonia 23,7
AMBIG_Europe 22,5
Karelia 18,6
Central-Europe 18,5
Finland 7,9
Karelian-Finnic 4,7
AMBIGUOUS 4,1
Pagani-FI21
Karelia 46,3
AMBIG_Europe 16,1
Finland 10,4
Baltic-Finnic 8,7
Northeast-Europe 8,5
Saami 4,3
AMBIGUOUS 2,9
Karelian-Finnic 2,8
I tested three Finns, seen above, two of them typical Western Finns without any obvious foreign admixture and one should be a typical Finn from East Finland. The first row below shows the average result using average Finnish reference picked from 1000-genomes and the second row shows the average result after changing the reference to Finnish samples of Pagani et al.
FI12, FI14 and FI21, average Finnish result when using average Finnsh reference 64,8
FI12, FI14 and FI21, average Finnish result when using Pagani Finnish samples as a reference 10,1
In this particular case, while Pagani Finns almost fully mismatch with average Finns, it also eliminates Finnish admixture of Swedish results where it is present in analyses based on average Finnish reference, in some cases substituting Finnish admixture by Karelian and Veps. This is really odd.
A map giving an estimate of admixture regions in Europe
keskiviikko 9. marraskuuta 2016
maanantai 31. lokakuuta 2016
Project admixtures, fitted ancient proportions
Here are ancient European proportions of project members and for comparison some academic present-day samples (not all fully covered by references, though), one random sample per each population. Results don't express primary proportions of Anatolian Neolithic and various hunter-gatherers populations, but add-ons over European LNBA samples. The European LNBA itself was already a genetic mixture, including admixtures similar to aforesaid West Eurasians and probably also of still unknown ancient populations. Similarly "BA East European Steppe" already included eastern hunter gatherer admixture. My aim was not to fix all admixtures on the same time level, but to get a good coverage and make project samples comparable to each other.
XLS-sheet is available from here.
lauantai 29. lokakuuta 2016
Project admixture results
While preparing my ancient haplotyping analyses I decided to test project members using Dna.Land's Ancestry program. Many thanks to authors for distributing it. All you need is to compile it and start your analyses,
All result are "as is" straight from the analyses. Some comments
- Finns and Norwegians are easily identified.
- Swedes and Estonians (the latter ones don't belong to to my project) can't be confidently identified by the academic reference I have used in this and in my previous analyses.
- many Finns have minor Saami admixture. This makes sense and Saami ancestry is the most likely source of the Finnish Siberian admixture. In most cases we can forget Nganasans and other distant and small Siberian populations. The minor Saami admixture among Finns is pervasive, not only pointing out Siberian ancestry, but to the complex history of ancient Fennoscandinavian, otherwise we would see in these results real Siberians also included into my tests (Nganasans, TunNenets, Nenets, Yakuts and numerous "semi-Siberians" from more southern North Asian regions.
- I didn't get weird "Finnish-South European" admixtures, seen on FamilyTreeDna and Dna.Land result pages. This because my Finnish reference is built of average Finns, not of Finnish minority groups.
- the ambiguous Balto-Slavic admixture among Finns is mostly from Latvia, Lithuania or Russian Tver. Russians living to the north from the Tver region are classified as "Northeast Europe", except Karelians and Veps who belong to Baltic-Finns with Estonians and Finns. Saamis form their own group.
- the ambiguous Northwest European admixture among Finns is mostrly Swedish.
- the ambiguous European admixture is usually some combination of two above-mentioned groups.
- "Ambiguous" means that the result of several individual bootstrap tests was ambiguous, meaning high dispersion of results.
All result are "as is" straight from the analyses. Some comments
- Finns and Norwegians are easily identified.
- Swedes and Estonians (the latter ones don't belong to to my project) can't be confidently identified by the academic reference I have used in this and in my previous analyses.
- many Finns have minor Saami admixture. This makes sense and Saami ancestry is the most likely source of the Finnish Siberian admixture. In most cases we can forget Nganasans and other distant and small Siberian populations. The minor Saami admixture among Finns is pervasive, not only pointing out Siberian ancestry, but to the complex history of ancient Fennoscandinavian, otherwise we would see in these results real Siberians also included into my tests (Nganasans, TunNenets, Nenets, Yakuts and numerous "semi-Siberians" from more southern North Asian regions.
- I didn't get weird "Finnish-South European" admixtures, seen on FamilyTreeDna and Dna.Land result pages. This because my Finnish reference is built of average Finns, not of Finnish minority groups.
- the ambiguous Balto-Slavic admixture among Finns is mostly from Latvia, Lithuania or Russian Tver. Russians living to the north from the Tver region are classified as "Northeast Europe", except Karelians and Veps who belong to Baltic-Finns with Estonians and Finns. Saamis form their own group.
- the ambiguous Northwest European admixture among Finns is mostrly Swedish.
- the ambiguous European admixture is usually some combination of two above-mentioned groups.
- "Ambiguous" means that the result of several individual bootstrap tests was ambiguous, meaning high dispersion of results.
| FI1 | |
| Finland | 63,9 |
| Ambiguous Northeast-Europe | 11,9 |
| RU_Pinega | 8,9 |
| Ambiguous Balto-Slavic | 6,9 |
| Ambiguous Europe | 4,6 |
| Iran_Jew | 2,9 |
| FI2 | |
| Finland | 42,5 |
| Ambiguous Northwest-Europe | 15,9 |
| Karelia | 9,7 |
| Ambiguous Balto-Slavic | 9,5 |
| Ambiguous Europe | 8,3 |
| Ambiguous Northeast-Europe | 7,2 |
| Ambiguous | 3,8 |
| Saami | 3,1 |
| FI3 | |
| Finland | 69,2 |
| Latvia | 13,0 |
| Ambiguous Baltic-Finnic | 8,2 |
| Ambiguous Northwest-Europe | 6,3 |
| Saami | 1,7 |
| Ambiguous | 1,4 |
| FI4 | |
| Finland | 51,8 |
| Ambiguous Northwest-Europe | 22,7 |
| RU_Smolensk | 9,8 |
| Ambiguous Northeast-Europe | 7,1 |
| RU_Pinega | 4,7 |
| Ambiguous Europe | 3,6 |
| FI5 | |
| Finland | 52,4 |
| Estonia | 17,4 |
| Karelia | 15,3 |
| Ireland | 11,0 |
| Saami | 2,0 |
| Ambiguous Europe | 1,1 |
| FI6 | |
| Finland | 43,8 |
| Karelia | 12,3 |
| Ambiguous Northwest-Europe | 11,7 |
| Ambiguous Baltic-Finnic | 10,2 |
| Lithuania | 9,5 |
| Ambiguous Northeast-Europe | 7,4 |
| Ambiguous Europe | 3,5 |
| Ambiguous Balto-Slavic | 1,0 |
| FI9 | |
| Finland | 44,2 |
| Karelia | 27,9 |
| Latvia | 12,4 |
| Ambiguous Europe | 10,4 |
| Ambiguous Baltic-Finnic | 3,4 |
| Ambiguous | 1,6 |
| FI11 | |
| Finland | 66,5 |
| Karelia | 22,5 |
| Ambiguous Europe | 8,3 |
| Saami | 2,3 |
| FI15 | |
| Finland | 63,3 |
| Karelia | 23,2 |
| Ambiguous Europe | 8,1 |
| Ambiguous Baltic-Finnic | 2,8 |
| Ambiguous | 2,6 |
| FI18 | |
| Finland | 54,7 |
| Karelia | 17,0 |
| Ambiguous Baltic-Finnic | 15,9 |
| Ambiguous Balto-Slavic | 5,8 |
| Saami | 3,5 |
| Ambiguous Europe | 3,1 |
| FI7 | |
| Finland | 84,3 |
| Ambiguous Balto-Slavic | 8,0 |
| TunNenets | 4,2 |
| Ambiguous Baltic-Finnic | 3,5 |
| FI8 | |
| Finland | 63,6 |
| Karelia | 24,9 |
| Ambiguous Europe | 10,6 |
| FI10 | |
| Finland | 48,7 |
| Saami | 22,0 |
| Karelia | 12,2 |
| Ambiguous | 6,0 |
| Nenets | 4,0 |
| Latvia | 3,2 |
| Ambiguous Europe | 2,8 |
| Ambiguous Siberian | 1,0 |
| FI12 | |
| Finland | 72,9 |
| Ambiguous Balto-Slavic | 16,0 |
| Ambiguous Europe | 6,6 |
| Ambiguous Baltic-Finnic | 3,3 |
| Ambiguous | 1,3 |
| FI14 | |
| Finland | 82,1 |
| Ambiguous Europe | 17,0 |
| FI16 | |
| Finland | 44,1 |
| Estonia | 26,5 |
| Karelia | 10,2 |
| Ambiguous Europe | 13,1 |
| Ambiguous Baltic-Finnic | 4,2 |
| Ambiguous | 1,9 |
| FI17 | |
| Finland | 32,7 |
| Karelia | 17,7 |
| Estonia | 15,2 |
| Sweden | 14,6 |
| Tatar | 7,0 |
| Ambiguous Europe | 6,5 |
| RU_Pinega | 5,5 |
| SC2 | |
| Utah_CEU | 18,4 |
| Ambiguous Northwest-Europe | 18,2 |
| Sweden | 17,6 |
| Belarussia | 10,8 |
| Welsh | 8,2 |
| Ambiguous Baltic-Finnic | 8,1 |
| Latvia | 5,9 |
| GermanyAustria | 5,8 |
| Ambiguous Balto-Slavic | 3,1 |
| Ambiguous | 2,9 |
| Ambiguous Europe | 1,1 |
| SC5 | |
| Sweden | 20,5 |
| Ambiguous Northwest-Europe | 19,7 |
| Ambiguous Baltic-Finnic | 19,3 |
| GermanyAustria | 13,1 |
| Ireland | 11,3 |
| Latvia | 5,1 |
| Ambiguous Central-Europe | 4,8 |
| Ambiguous Europe | 4,6 |
| Ambiguous Balto-Slavic | 1,5 |
| SC7 | |
| Norway | 20,0 |
| Sweden | 19,9 |
| Veps | 13,9 |
| Kent | 12,9 |
| Orcadian | 12,5 |
| Ambiguous Europe | 9,3 |
| Ambiguous Central-Europe | 7,0 |
| Ambiguous Northwest-Europe | 2,3 |
| Ambiguous Baltic-Finnic | 2,0 |
| SC3 | |
| Norway | 17,9 |
| France | 17,5 |
| Estonia | 16,7 |
| Finland | 14,2 |
| Utah_CEU | 14,0 |
| Ambiguous Europe | 7,2 |
| Ambiguous Northwest-Europe | 6,6 |
| Scotland | 5,6 |
| SC4 | |
| Norway | 53,0 |
| Ambiguous Northwest-Europe | 24,3 |
| Ambiguous Central-Europe | 11,2 |
| Ambiguous Europe | 5,5 |
| Veps | 5,2 |
| SC6 | |
| Utah_CEU | 35,5 |
| Finland | 17,5 |
| Ambiguous Northwest-Europe | 14,2 |
| Ambiguous Balto-Slavic | 9,5 |
| Veps | 8,7 |
| GermanyAustria | 7,7 |
| Ambiguous Northeast-Europe | 4,3 |
| Ambiguous | 1,6 |
| Ambiguous Europe | 1,0 |
tiistai 18. lokakuuta 2016
European coarse population structure using 14.4 millions markers
I already made a Finestructure analysis before my previous Admixture based work, but didn't publish it because it gave so little additional information. I used same data than with Admixture. The workflow:
1 extracting chrpmosomes 1 and 6
2 running haplotypes (HAPI-UR ten times and making consensus)
3 running Chromopainter in linked mode, without defining donor haplotypes
4 running Finestructure with parameters burning 200000 and runtine 2000000
As a result we see a very obvious grouping, each ethnic group are grouped together. Some cautions have to be made about Chromopainter-Finestrucure combination
- first at all, Finestructure doesn't really use dedicated haplotypes, but the number of shared haplotypes and haplotype lengths between individuals. So there is no guarantee that in a triple sample case (individuals a, b and c) all three share common haplotypes, even when the result of Finestructure shows up haplotype sharing for all three samples. This can lead to a pseudo-ancestry between individuals and also to a wrong tree grouping.
- using donor haplotypes can be methodically unreliable. We can assign donor haplotypes for people living in Americas, but it is not equally reliable for people living in the old world. It is a chicken egg question. If we really know donors before testing we know the result before we have the result. I have seen methods creating donor types (selections of prepared haplotypes), but I can't see how it could really work reliably. Note also that speaking about donor populations (I have seen it) makes this even a more problematic question; to know donor populations we already know the population grouping before the analysis and bind donor populations to something that exists today, but did not necessarily exist thousands years ago.
While checking the data I see there a questionable sample qroup: Swedes. They look more eastern than can be healthily suggested.
In general, looking at any results the first question is "does the result look obvious?". If we have two different results based on any kind supervised method (like using donor haplogroups/populations) it is only common sense to see the more obvious result being the better one. Here we have a philosophic question: what "the obvious" means for you and for me. It makes sense, but an idea as "too obvious" lead us to tin foil hat theories. Perfection is suspicious. We don't want it, although also it is in practice possible. Another, much more sensible question in regards to donor haplotypes would be if we could assign donor haplotypes of Bronze Age Europeans based on ancient samples. It would make sense.
Dowload Finestructure picture here.
1 extracting chrpmosomes 1 and 6
2 running haplotypes (HAPI-UR ten times and making consensus)
3 running Chromopainter in linked mode, without defining donor haplotypes
4 running Finestructure with parameters burning 200000 and runtine 2000000
As a result we see a very obvious grouping, each ethnic group are grouped together. Some cautions have to be made about Chromopainter-Finestrucure combination
- first at all, Finestructure doesn't really use dedicated haplotypes, but the number of shared haplotypes and haplotype lengths between individuals. So there is no guarantee that in a triple sample case (individuals a, b and c) all three share common haplotypes, even when the result of Finestructure shows up haplotype sharing for all three samples. This can lead to a pseudo-ancestry between individuals and also to a wrong tree grouping.
- using donor haplotypes can be methodically unreliable. We can assign donor haplotypes for people living in Americas, but it is not equally reliable for people living in the old world. It is a chicken egg question. If we really know donors before testing we know the result before we have the result. I have seen methods creating donor types (selections of prepared haplotypes), but I can't see how it could really work reliably. Note also that speaking about donor populations (I have seen it) makes this even a more problematic question; to know donor populations we already know the population grouping before the analysis and bind donor populations to something that exists today, but did not necessarily exist thousands years ago.
While checking the data I see there a questionable sample qroup: Swedes. They look more eastern than can be healthily suggested.
In general, looking at any results the first question is "does the result look obvious?". If we have two different results based on any kind supervised method (like using donor haplogroups/populations) it is only common sense to see the more obvious result being the better one. Here we have a philosophic question: what "the obvious" means for you and for me. It makes sense, but an idea as "too obvious" lead us to tin foil hat theories. Perfection is suspicious. We don't want it, although also it is in practice possible. Another, much more sensible question in regards to donor haplotypes would be if we could assign donor haplotypes of Bronze Age Europeans based on ancient samples. It would make sense.
Dowload Finestructure picture here.
perjantai 14. lokakuuta 2016
Worldwide admixture analysis based on 14.4 million SNP's
The EGDP data, available from Estonian Biocenter, made it possible to reach 15-30 times more genome density than earlier available data made possible. The new data lacks of West European samples, but it was not a big problem due to the publicly available western data from the 1000-genomes project. So I merged these two data sets. For the quality check I ran heterozygosity rates for all European samples in both data sets and found both sets being considerably close each other, although the read depth of the 1000-genome data is smaller. Actually Finnish samples in both sets showed exactly same level of heterozygosity.
After the succesful merge I had 14.4 million SNPs over all 22 chromosomes, which was far too much to process in few days on my desktop (i7, 3.5Ghz, 32 GB memory). Instead of thinning the whole data set to 1-2 millions SNPs I decided to use chromosomes 1 and 6 and leave the genome density untouched. So I had two chromosomes, a bit over 2 million SNPs showing still 15-30 times more genotype information per chromosome than other available genotype sets. Considering thinning over all chromosomes to get the dataset handy enough to be processed with my computer would likely have induced more algorithm dependent bias, which I wanted to avoid.
The process
1 merging EGDP and 1000g data sets
2 quaility checks, including homozygosity/heterozygosity ratios per populations
3 extracting chromosomes 1 and 6
4 thinning data by Plink: plink --file data --indep 50 5 2, resulting 1.1 million SNPs
5 running admixture analyses with k values from 3 to 13 in unsupervised mode and without reference populatons (=projection).
Each k-value was run in unsupervised mode without reference data, because projection reference data is not available for this SNP set. You can see analyses using projection reference for example in works analysing ancient and moderm genomes together. Analyses made on any kind of projection are cool, because we have no other way to designate proportion of ancient samples to modern ones. I am not saying that unsupervised analysis without references would be error-free, but that errors are systemic and not user dependant.
All analyses (k-values from 3 to 13) done here are run as individual runs without user supervision and for that reason colors on charts are not consistent (at least it sounded like a painful work the get colors consistent). Each analysis is optimized separately by the Admixture algorithm. All this makes it more difficult to perceive differences between different K values, but as soon as you get the idea I am sure you also can see the big picture and understand details.
Hopefully this test is helpful for you. In my opinion, it gives interesteing hints about Finnish relations with other populations, but the analysis itself is wordwide.
- Mordvins seem to differ from other Volga-Finnic populations and belong to Balto-Slavic ancestry and they probably are language shifters from a Baltic to a Volga-Finnic language.
- Estonians are just what can be expected, some Estonians have Baltic ancestry, some others Baltic-Finnic ancestry. We should, however, be cautious of in using linguistic terms when we speak about ancestry.
- North Russian Finno-Ugric populations seem to be Baltic-Finnic people with Siperian admixture. The Siberian admixture is present in a lesser amount among Finns and Estonians (note that the amount of minor admixtures depends on the used data/populations and Admixture is based on a selective method processing admixture proportions relatively).
- in some extent also Swedes show Baltic-Finnic ancestry, but the Swedish sample size is rather small to make a sure conclusion. However, if this is true, we can assume the present-day Baltic-Finnic people having largely Fennoscandinavian ancestry.
- Ingrian samples show up like pure unadmixed Baltic-Finnic people, which surprises me because of their long lasting minority status in Russia. Sample collectors have done good work. Those samples are valuable indeed.
- thinking all this and trying to rebuild the the history of Baltic-Finnic people it looks like they lived to the north from the axis Latvia-Moscow (Balts living to the south before the East-Slavic expansion). Mixing between Baltic and Finnic people happened and people also shifted language.
- open questions are how strong the Baltic-Finnic influence is/was in Scandinavia and conversely how strong the Germanic influence is/was in Finland and Estonia. For certain political reasons it is a difficult approach today.
CV errors, indicating quality in general, the lower the value is the better the quality, but absolute values depend on the used data and can't be compared to other Admixture tests.
K3: 0.19708
K4: 0.19503
K5: 0.19480
K6: 0.19451
K7: 0.19432
K8: 0.19503
K9: 0.19508
K10: 0.19576
K11: 0.19708
K12: 0.19797
K13: 0.20221
Population abbreviations, download here
Analysis, download here.
You definitely need a suitable picture viewer being able to handle big GIF-files.
After the succesful merge I had 14.4 million SNPs over all 22 chromosomes, which was far too much to process in few days on my desktop (i7, 3.5Ghz, 32 GB memory). Instead of thinning the whole data set to 1-2 millions SNPs I decided to use chromosomes 1 and 6 and leave the genome density untouched. So I had two chromosomes, a bit over 2 million SNPs showing still 15-30 times more genotype information per chromosome than other available genotype sets. Considering thinning over all chromosomes to get the dataset handy enough to be processed with my computer would likely have induced more algorithm dependent bias, which I wanted to avoid.
The process
1 merging EGDP and 1000g data sets
2 quaility checks, including homozygosity/heterozygosity ratios per populations
3 extracting chromosomes 1 and 6
4 thinning data by Plink: plink --file data --indep 50 5 2, resulting 1.1 million SNPs
5 running admixture analyses with k values from 3 to 13 in unsupervised mode and without reference populatons (=projection).
Each k-value was run in unsupervised mode without reference data, because projection reference data is not available for this SNP set. You can see analyses using projection reference for example in works analysing ancient and moderm genomes together. Analyses made on any kind of projection are cool, because we have no other way to designate proportion of ancient samples to modern ones. I am not saying that unsupervised analysis without references would be error-free, but that errors are systemic and not user dependant.
All analyses (k-values from 3 to 13) done here are run as individual runs without user supervision and for that reason colors on charts are not consistent (at least it sounded like a painful work the get colors consistent). Each analysis is optimized separately by the Admixture algorithm. All this makes it more difficult to perceive differences between different K values, but as soon as you get the idea I am sure you also can see the big picture and understand details.
Hopefully this test is helpful for you. In my opinion, it gives interesteing hints about Finnish relations with other populations, but the analysis itself is wordwide.
- Mordvins seem to differ from other Volga-Finnic populations and belong to Balto-Slavic ancestry and they probably are language shifters from a Baltic to a Volga-Finnic language.
- Estonians are just what can be expected, some Estonians have Baltic ancestry, some others Baltic-Finnic ancestry. We should, however, be cautious of in using linguistic terms when we speak about ancestry.
- North Russian Finno-Ugric populations seem to be Baltic-Finnic people with Siperian admixture. The Siberian admixture is present in a lesser amount among Finns and Estonians (note that the amount of minor admixtures depends on the used data/populations and Admixture is based on a selective method processing admixture proportions relatively).
- in some extent also Swedes show Baltic-Finnic ancestry, but the Swedish sample size is rather small to make a sure conclusion. However, if this is true, we can assume the present-day Baltic-Finnic people having largely Fennoscandinavian ancestry.
- Ingrian samples show up like pure unadmixed Baltic-Finnic people, which surprises me because of their long lasting minority status in Russia. Sample collectors have done good work. Those samples are valuable indeed.
- thinking all this and trying to rebuild the the history of Baltic-Finnic people it looks like they lived to the north from the axis Latvia-Moscow (Balts living to the south before the East-Slavic expansion). Mixing between Baltic and Finnic people happened and people also shifted language.
- open questions are how strong the Baltic-Finnic influence is/was in Scandinavia and conversely how strong the Germanic influence is/was in Finland and Estonia. For certain political reasons it is a difficult approach today.
CV errors, indicating quality in general, the lower the value is the better the quality, but absolute values depend on the used data and can't be compared to other Admixture tests.
K3: 0.19708
K4: 0.19503
K5: 0.19480
K6: 0.19451
K7: 0.19432
K8: 0.19503
K9: 0.19508
K10: 0.19576
K11: 0.19708
K12: 0.19797
K13: 0.20221
Population abbreviations, download here
Analysis, download here.
You definitely need a suitable picture viewer being able to handle big GIF-files.
torstai 8. syyskuuta 2016
Worldwide diversity based on 3.2 millions X chromosome markers
Genetic diversity tests are usually done using around 300-500 thousands markers. It is however possible to use much more markers (SNPs) using already available data from the 1000 genomes project. The downside is that we have only a few populatons and the upside is that we see the big picture accurately, without possible bad sampling.
I made this test using Chromopainter and Finestructure. Unfortunately Chromopainter is a rather ineffective tool and incapable to use available computing resources (threads, memory). Without this drawback I would have made this using 25 millions markers instead of only 3.2 millions.
The process:
1 Vcftools, parameters -remove indels -chr 23
2 Haplytyping using HAPI-UR and all samples, run three times and driven in consensus
3 Made a manual selection for random samples, 10-20 of each population
4 Chromopainter, without specifying donor haplotypes
5 Finestructure with run parameters 30000/300000
6 MDS using Past.
Additionally I ran Vcftools using parameters -keep-only-indels and -chr 23. The result was filtered and biallelic deletions (CN=0) were counted. Male results were treated biallelic, so CN=0 should give us the number of effectine deletions in both cases, for females and males.
Finestructure
MDS done by Past:
All previous pictures are downloadable with better resolution, here.
Deletions per 3.2 million markers (averages per sample):
The British subgrouping is gathered from internet and can be unreliable. The Finnish one represents those with highest Siberian admixture, the group being "most Finnish" / local, those closest ancient Corded Ware samples and the rest of all 99 samples. The last Finnish group includes all outliers.
I made this test using Chromopainter and Finestructure. Unfortunately Chromopainter is a rather ineffective tool and incapable to use available computing resources (threads, memory). Without this drawback I would have made this using 25 millions markers instead of only 3.2 millions.
The process:
1 Vcftools, parameters -remove indels -chr 23
2 Haplytyping using HAPI-UR and all samples, run three times and driven in consensus
3 Made a manual selection for random samples, 10-20 of each population
4 Chromopainter, without specifying donor haplotypes
5 Finestructure with run parameters 30000/300000
6 MDS using Past.
Additionally I ran Vcftools using parameters -keep-only-indels and -chr 23. The result was filtered and biallelic deletions (CN=0) were counted. Male results were treated biallelic, so CN=0 should give us the number of effectine deletions in both cases, for females and males.
Finestructure
MDS done by Past:
All previous pictures are downloadable with better resolution, here.
Deletions per 3.2 million markers (averages per sample):
The British subgrouping is gathered from internet and can be unreliable. The Finnish one represents those with highest Siberian admixture, the group being "most Finnish" / local, those closest ancient Corded Ware samples and the rest of all 99 samples. The last Finnish group includes all outliers.
lauantai 20. elokuuta 2016
Mitochondrial diversity in Europe
Methods
I have seen several mitochondrial statistics using main haplogroups, H, U, I etc. Haplogroups, being tens of thousand years old are a very robust way to analyze geographic areas where people have moved and mixed during latest centuries and in maximum during some thousands years. Because of this I decided to use mutation information based on RSRS-reference. The RSRS was introduced a few years ago and lists mitochondrial mutations defined from so called "mito-Eve", from the reconstructed first woman in the human ancestral tree. Even RSRS lets lot to be desired, because many mutations are common in several mitochondrial branches.
Data
The data is collected from publicly available FamilyTreeDna's projects and includes two hypervariable regions, HVR1 and HVR2. HVR2 is not available for all samples, in those cases it is marked as "no call", otherwise all mutations are included.
Countries and sample sizes
Finnish sample size is probably biggest ever seen in academic or any studies. Even taking into account some bias in regional personal activity this have to be the best ever seen sample data from Finland.
Some geographical areas are underrepresented, like White Sea Karelians, but I was expecting some interest and included them.
Results
Fst distances
Seeking for country level rather than individual statistics I ran at first Fst-statistics between countries. Keeping in mind the nature of mitochondrial data and mutations it is not relevant to expect any strict ancestral sum information, on the contrary results mirror European migrations during thousands years.
Fst distances
Image with better resolution can be downloaded here
MDS-plot based on Fst-distances:
Two dots to the most left are Poland and Germany.
And classical euclidean tree plot:
edit 20.0.2016 13:40
Here I reconstructed mitochondrial genome instead of using straightforwardly hypervariable mutations. Reconstructed SNP data was analyzed by standard analyzing tools. I am very sure that analyzes done using only mutation indicators will not be successful.
22.9.2016 11:30
Added Fst and genome data. Notice that the genome data is reconstructed using minimum labor input and original kit-id numbers are substituted by surrogates!
Fst-data download here
Genome data download here
I have seen several mitochondrial statistics using main haplogroups, H, U, I etc. Haplogroups, being tens of thousand years old are a very robust way to analyze geographic areas where people have moved and mixed during latest centuries and in maximum during some thousands years. Because of this I decided to use mutation information based on RSRS-reference. The RSRS was introduced a few years ago and lists mitochondrial mutations defined from so called "mito-Eve", from the reconstructed first woman in the human ancestral tree. Even RSRS lets lot to be desired, because many mutations are common in several mitochondrial branches.
Data
The data is collected from publicly available FamilyTreeDna's projects and includes two hypervariable regions, HVR1 and HVR2. HVR2 is not available for all samples, in those cases it is marked as "no call", otherwise all mutations are included.
Countries and sample sizes
Finnish sample size is probably biggest ever seen in academic or any studies. Even taking into account some bias in regional personal activity this have to be the best ever seen sample data from Finland.
Some geographical areas are underrepresented, like White Sea Karelians, but I was expecting some interest and included them.
Results
Fst distances
Seeking for country level rather than individual statistics I ran at first Fst-statistics between countries. Keeping in mind the nature of mitochondrial data and mutations it is not relevant to expect any strict ancestral sum information, on the contrary results mirror European migrations during thousands years.
Fst distances
Image with better resolution can be downloaded here
MDS-plot based on Fst-distances:
Two dots to the most left are Poland and Germany.
And classical euclidean tree plot:
edit 20.0.2016 13:40
Here I reconstructed mitochondrial genome instead of using straightforwardly hypervariable mutations. Reconstructed SNP data was analyzed by standard analyzing tools. I am very sure that analyzes done using only mutation indicators will not be successful.
22.9.2016 11:30
Added Fst and genome data. Notice that the genome data is reconstructed using minimum labor input and original kit-id numbers are substituted by surrogates!
Fst-data download here
Genome data download here
Tilaa:
Blogitekstit (Atom)
Some ancestral changes in Iron Age Estonia
QpAdm was designed to detect admixtures giving also probability and standard error statistics. Two kind of parameters are inputted: admixtu...
-
Testing ancient "steppe" samples on PCA together with modern ones revealed unexpected issues. Studies have included different set...
-
This is probably not a popular writing, but I am not a politician and I don't need to please anyone. Here is the issue: why the yDna d...
-
Unfortunately the Lamnidis et al. 2018 did not test the origin of the Siberian ancestry in present-day Finns and Russians. I reveal it now...