I have seen
numerous PCA and ADMIXTURE analyses which try to demonstrate who are full-blooded
Europeans, as well as many analyses proving real or false migration inside/outside
Europe. This is sometimes misleading and hides actual European
ancestry because admixtures revealed by selective tests can be very small and
detectable only by detaching it from main history events in Europe. My aim is now to find out large scale similarities
inside Europe. This can be done by using dstat-analyses which compares whole
genomes without dropping meaningful genetic proportions. I do now tests by searching differences between
suggested non-European and actual European ancestries.
I suggest following non-European populations
- Nganassans representing pure Siberians, found in North Siberia and Northeast Europe
- Mongolians representing medieval Mongolian invasion to Europe
- Bedouins representing present-day Middle-Easterners, ruling out Early European Farmers
Doing any comparison needs a baseline, suggested least admixed Europeans. Brits live in an island isolated from the
mainland Europe. People in Kent are thought
to have their origin in Iron Age and medieval continental West Europe. My previous analyses also prove that they
have very little newer non-European admixtures, less than French and Germans.
I use original Haak et al 2015 Lazaridis et al. 2014 data with additional British Kent and
Finnish samples downloaded from the 1000genome project. Each sample consists of 555268 SNPs. West Finns
are filtered in three steps using PCA from 1000genome data: 1) removing 20 westernmost samples to get rid
of possible Finland-Swedes, 2) splitting the rest 80 into eastern and western groups and finally 3) picking randomly 13 western samples. Kents are randomly sampled as well.
The data is available if
someone wants to repeat my tests, or make own tests. Please contact me in that
case.
The first
task to do is to verify the data. For
this purpose I ran three PCA-plots:


Before
testing admixtures it is a good idea to see wide genome distances between
British Kents and other Europeans. I do it using two outgroups, the first one being extreme (Chimp), setting another one (Ju-hoan-North) to the base line.

Admixture Dstat
analyses follow the formula:
dstat(Kent,non-European
population:Outgroup,European population).
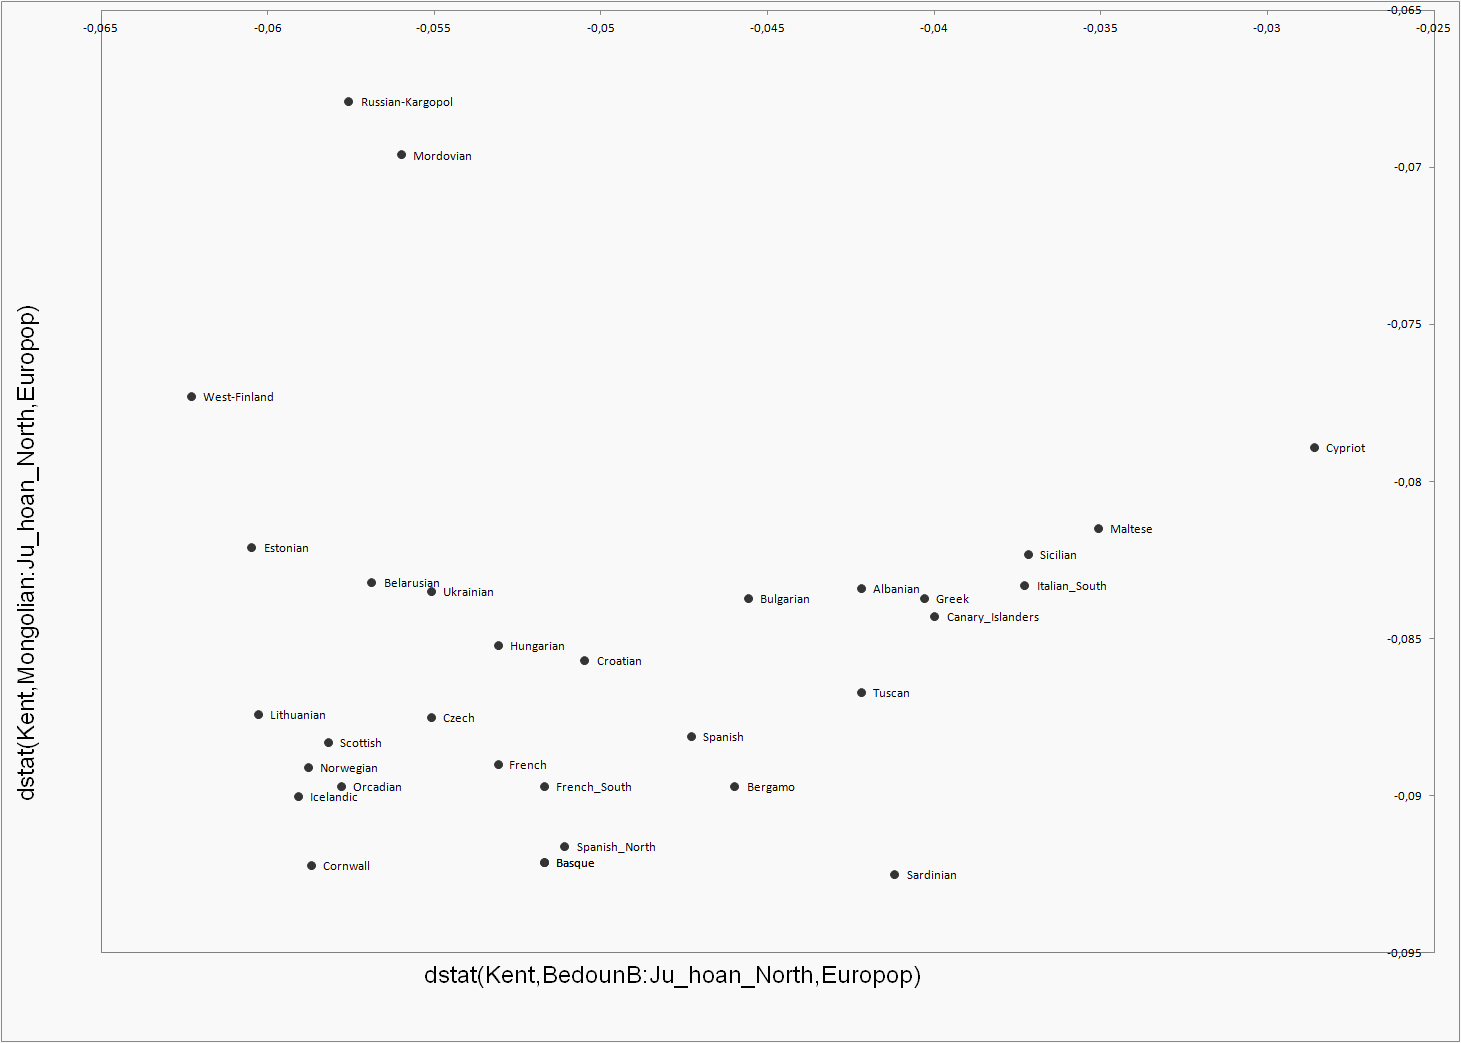

If the
result is negative the European population is closer to Kent than it is to
the non-European population on axis, the bigger the negative value is the closer it is to the Kent
compared to non-European population. Be
aware of the fact that this test doesn’t figure how much the population under
test has non-European admixture in question, but the full genome genetic distance
between populations, which mainly depends on the common history between population pairs. If tested European population is
“multimixtured” then the result could be surprising for a reader who has seen
only analyses figuring minor admixtures. In other words, your genetic profile can be A1+b
or A2+c, where b and c are minor admixtures. You can’t figure the overlapping between A1 and A2 without knowing both minor admixtures if you try to do it using PCA or ADMIXTURE, but you can use dstat to determine genomewide similarity.


