tiistai 6. tammikuuta 2015

Admixture analysis of the Baltic Sea region


This test will show genetic similarities in the Baltic Sea region.  It works well for all people from Northern Russia to Norway, including all areas alongside Baltic Sea.  It doesn’t work if your origin is more southern or eastern, including that you are an immigrant with genetic admixture from other regions.   This test doesn’t tell exactly the place where you are from or your ancestry is from, not even in the above-mentioned zone. It doesn’t tell about ancient migrations.  It tells reliably about genetic similarities between people.   

I implemented this test into the DIYDodecad procedure (made and authorized by Dienekes), but to reach the goal I made some changes to the original run procedure, to get more resolution.   It is clear to me that the original concept loses genetic signals.

Another question is how to select reference samples to obtain local genetic differences.  I used PCA to find out criterions.  The selection is based on the fact that all ancient migrations came to Northern Europe through same routes.  It is easy to see how this happened by analyzing European-wide PCA-pictures. 


kuva

This PCA represents also samples used in this admix analytsis.  Distances on the plot don't correspond to genetic distances, the main European cluster is shrunk by the distance impact of Uralic groups.

Using PCA I cropped all Near Eastern and Caucasian samples, as well as all behind them seen from the European perspective.   Almost all Near Eastern gene flow came to North Europe through South and West Europe.  All this can be seen on PCA-pictures.  Some Asian gene flow came from the east to Baltic Sea, especially to Russia and Finland.  So I included some Uralic populations to represent this gene flow, but I didn’t took any East or North Asian samples, because eastern Uralic people, speaking Uralic and Turkic languages, show up to 30% of Siberian gene flow in Europe and adding Asians would have reduced local resolution.   
   
Some notes

- I tried to balance the size of ethnic groups and avoid oversampling local populations.

- I use Finnish old settlement samples only.  The sample group is cleaned of all samples with foreign admixture as well as I can do it.  Finnish samples represent most likely Tavastians.  

- I don't make population dependent LD-prosessing.  IMO LD-pruning is often the reason of poor results, among with oversampling of test groups.

- I still miss North German and Saami samples.  It would be nice to have also those Baltic-Finnic Russian minorities which are available for Russian researchers.
  
- I use only public data distributed by universities, thus all individual DIY-results are free of the “calculator effect”.  ADMIXTURE runs are carried out in two phases.  In the initial phase samples were run in UNSUPERVISED mode.  The output phase was run in SUPERVISED mode using all homogeneous populations as control groups, despite of their admixture rate shown in the preceeding unsupervised run.  By this mean I was hopefully able to fix the usual problem of homogeneous populations ruining admixture analyses.  This means that any population showing for all individuals results like 30%/70% in two k-group is considered as a control group, but if individuals under same population label show various admixes it is not used as a control in the supervised output phase.

- I cannot publish k-distribution data per used samples because of the overfitting in admixture runs and because I have not enough samples to run meaningful “calculator effect” free results.  But here are some results for instance:

Lithuanian k6
17.46% West-Europe
16.49% North-Baltic
2.56% South-Europe
4.50% East-Europe&Volgaic
51.92% E-Cntral-Euro&S-Balt
7.08% Southeast-Europe 

Lithuanian k7
17.11% West-Europe
14.76% North-Baltic
2.43% South-Europe
16.82% North-Russia
2.07% East-Europe&Volgaic
39.94% E-Cntral-Euro&S-Balt
6.88% Southeast-Europe

North Russian k6
15.69% West-Europe
14.97% North-Baltic
5.81% South-Europe
19.05% East-Europe&Volgaic
37.83% E-Cntral-Euro&S-Balt
6.65% Southeast-Europe

North Russian k7
15.49% West-Europe
12.58% North-Baltic
5.68% South-Europe
20.67% North-Russia
15.55% East-Europe&Volgaic
23.70% E-Cntral-Euro&S-Balt
6.33% Southeast-Europe

North American k5
42.61% West-Europe
9.36% North-Baltic
25.47% South-Europe
2.79% East-Europe&Volgaic
19.77% E-Cntral-Euro&S-Balt

North American k6
39.04% West-Europe
10.26% North-Baltic
17.24% South-Europe
3.02% East-Europe&Volgaic
19.60% E-Cntral-Euro&S-Balt
10.84% Southeast-Europe

North American k7
38.80% West-Europe
9.24% North-Baltic
17.13% South-Europe
 8.42% North-Russia
1.91% East-Europe&Volgaic
13.84% E-Cntral-Euro&S-Balt
10.67% Southeast-Europe

Southwestern Finnish k6
25.25% West-Europe
27.50% North-Baltic
3.94% South-Europe
11.39% East-Europe&Volgaic
26.53% E-Cntral-Euro&S-Balt
5.38% Southeast-Europe

Southwestern Finnish k7
24.99% West-Europe
26.20% North-Baltic
3.67% South-Europe
11.76% North-Russia
9.48% East-Europe&Volgaic
18.59% E-Cntral-Euro&S-Balt
5.32% Southeast-Europe

Mediterranean peaks in Central Italy extending to North Italy and to the Iberian Peninsula.  West Europe peaks in England and Norway.  North Baltic peaks in Finland, Tavastia.  East-Central Euro&South Baltic peaks in Belarussia and Lithuania.  East Europe peaks in Volga/Ural regions and North Russia in Kargopol/Vologda/Mordva regions.  Southeast Europe is highest among Bulgarians and Romanians.

You can download all necessary Diydodecad files to perform your own tests, download files from here.  In running analyses use parameters “k<n>.par”, where n represents the desired k value, 5, 6 or 7.   More detailed instructions about Diydodecad and installation can be found here and original Diydodecad files are downloadable here.  My download package however includes all necessary to run tests.

You can download the genotype data used in this test in EIGENSTRAT format, here.  It is possible to convert it to PED format using for example Eigensoft's CONVERTF, the result is usable although you'll probably lose original allele pairs.

tiistai 9. joulukuuta 2014

Big comparison of ancient samples


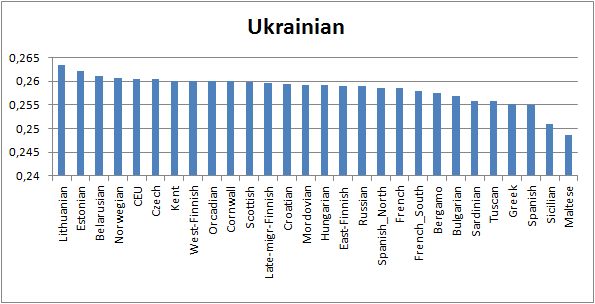
F3-statistics measures common genetic drift between populations.   I have done a simple run using ancient genomes and Eigensoft’s qp3Pop program, comparing all those ancient genomes to present-day populations and moved results to Excel graphics.  The bigger the result is the more the present population shares drift with ancient samples.

Ancient genomes:

Loschbour M Luxembourg_Mesolithic
LBK F GermanStuttgart_LBK
Otzi M Tyrolean_Iceman Copper Age
MA1 M Siberian_Upper_Paleolithic
AG2 M Siberian_Ice_Age
Scandinavian_HG M Swedish_HunterGatherer Neolithic
Scandinavian_farmer F Swedish_Farmer Neolithic
Motala12 M Swedish_Motala 7000 years old
LaBrana M    LaBrana Mesolithic
AngloSaxon several samples UK Hinxton Iron Age
Briton several samples UK Hinxton Iron Age
NE1…NE7  Hungarian Neolithic
KO1 Hungarian Neolithic
CO1 Hungarian Copper Age
IR1 Hungarian Iron Age
BR2 Hungarian Bronze age

The formula is f3(Mbuti;test1,test2)

All results can be downloaded and unzipped here.

I couldn’t resist to look why I have at 23andme many “cousins” in Southern Russia and Ukraine, but no one in Nothern Russia.  This looked weird because I have heard always that the Finns are from the north.  Indeed, Western Finns, like me,  are closer Ukrainians in terms of the common genetic drift than Northern Russians (Mordva and Russian people closer White Sea).  Surprising. 


sunnuntai 7. joulukuuta 2014

Starting with new data


I am now starting with a new data set and hopefully I can give you more reliable results.  My new set is based on the data publicly available from Lazaridis et al. 2014.   Some additions were made:

 Finnish, British and CEU samples from the 1000-genomes project
 5 ancient British samples from Hinxton
 8 ancient Hungarian samples (from Y-Str server)

Going to Lazaridis’ data meant also changing to Affymetrix coordinates.   Affymetrix doesn’t fit well with most commercial SNP sets, but seems to give better coverage for many ancient samples.  Switching to Affymetrix  was not a problem to me because my private sample collection is not big and I can give it away and take the advantage of better data.   Now I have

2244 samples
555268 SNP’s

The individual sample data mostly covers the whole 550kSNP, also many ancient samples reach over 500kSNP. 

Present ancient genomes
BR2-Hungarian
CO1-Hungarian
IR1-Hungarian
KO1-Hungarian
NE1-Hungarian
NE5-Hungarian
NE6-Hungarian
NE7-Hungarian
Hinxton1
Hinxton2
Hinxton3
Hinxton4
Hinxton5
Denisova
Loschbourr
LBK
Mezmaiskaya
Otzi
Saqqaq
MA1
AG2
Swedish_HunterGatherer
Swedish_Farmer
Motala_merge
Motala12
LaBrana
Denisova_light
Vindija_light

I am not yet familiar with those ancient samples and it takes a time to find out their secrets.

While I have a new data I am also starting with a new software toolkit.   I found the Eigenstrat format handy, because it is also easy to handle with SQL-tools.  This decision led to another one, to use Eigensoft’s software.  Luckily they just a few weeks ago released a new version.  

It is the time to uncork the new data, starting with Eigensoft’s excellent PCA tool.  It is capable to do many thing, like LD-pruning, random sample selection, sample projection etc.   Now I use only the random sample selection, which ensures that none of populations are oversampled.   I use the whole 550k data and  I do not use LD-pruning for two reasons.  At first it is not necessary to avoid excessive clustering.  Working with the LD-pruned data I did not notice any improvement in clustering.   Secondly, LD-pruning can be disadvantageous, because not all populations have the same genetic drift to remove.  Generally the LD-pruning must be used carefully and it is not for dummies like me, so I use it seldom and trust to the original data.

PCA including Europeans


Fst-distance table.  Average standard error is 0,000762745, meaning that there can be an error of one thousandth of unity.


Fst-table

perjantai 21. marraskuuta 2014

Do_it_yourself Dodecad test for Finns (including Baltic Finns in general)


Wondering the Finnish history and migrations that happened during the last 2000 years I have done the following Do-It-Yourself Dodecad test.   My goal was to achieve a dedicated test for Finns, but it could work also for Estonians and other Baltic-Finnic people.  This test doesn’t work for other nationalities due to the regional reference assortment.  What I have done differently than in many other Dodecad Oracle tests is not only the reference selection, but also I had a tighter Finnish sample qualification.  It is also reasonable to mention that in some tests the preprocessing of genotype data has been biased.  My data includes 290000 SNPs and it doesn’t include any preprocessing based on differences between populations.  So it is as it is, straight from the stock.  

Reference populations:

Finnish
Mari
Chuvash
Mordva
Estonian
Lithuanian
Belarussian
Polish
Swedish
Norwegian

You don ‘t need to worry about the “calculator effect”, because all my data is from public academic sources.

To perform the test you at first have to download DiyDodecad scripts.  You can do it here


Please notice that DiyDodecad is authorized by Dienekes and included in his Dodecad Ancestry Project:


After you have uncompressed all files into your own directory (for instance Kaleva) you have to download and uncompress four Kaleva-specific files to the same directory. 

 Files


Now everything is ready for making first analyses, to do it you need to read README.txt and follow Dienekes’ instructions, the only difference is that you need to use KALEVA.par instead of the Dodecad dv3.par file.


Some ancestral changes in Iron Age Estonia

QpAdm was designed to detect admixtures giving also probability and standard error statistics.  Two kind of parameters are inputted: admixtu...